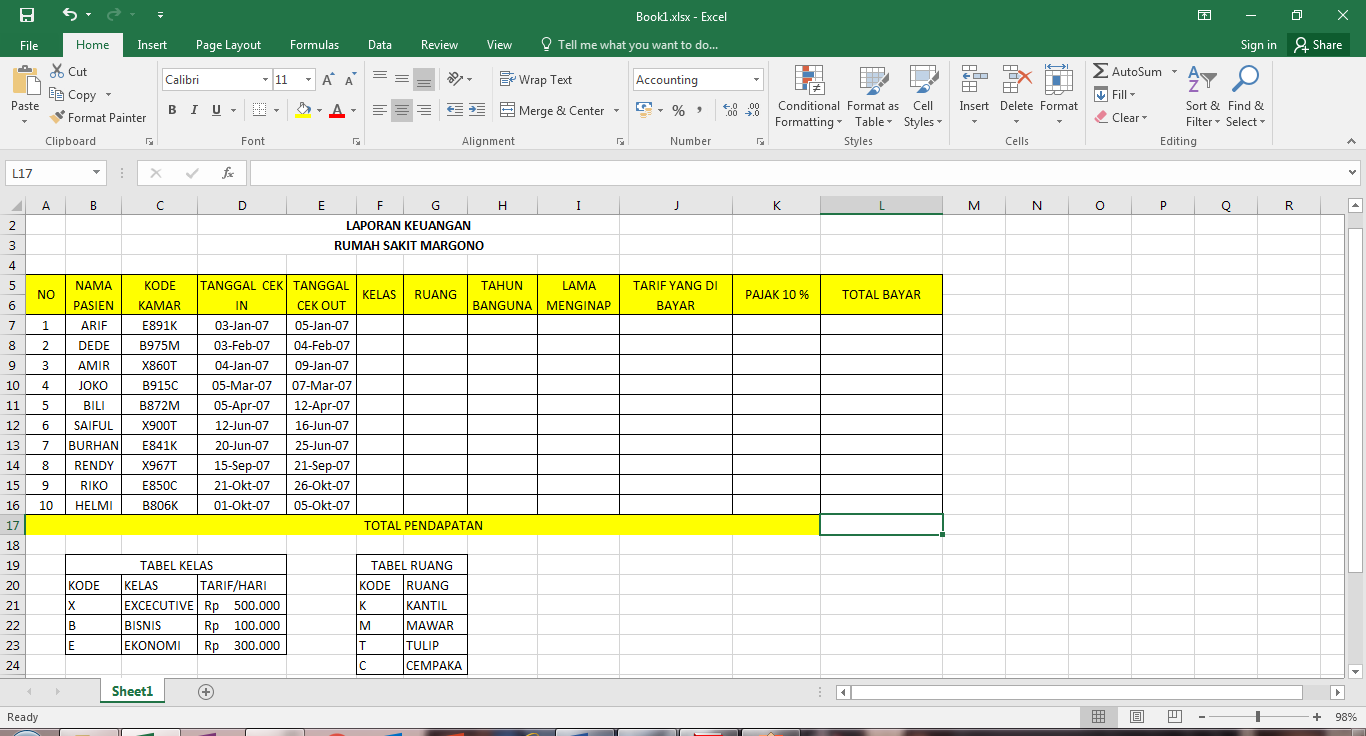
Creating financial reports can be a daunting task, especially for those who do not have a background in accounting. Fortunately, with the advancement of technology, there are now tools such as Excel that can make this task much more manageable. In this article, we will provide you with tips on how to create financial reports using Excel, as well as some example formats you can use to get started.
Why use Excel for financial reports?
Excel is a powerful tool that can streamline your financial reporting process. Some of the benefits of using Excel for financial reporting include:
- Organize data: Excel allows you to easily input and organize data from various sources, making it easier to create reports that are accurate and complete.
- Customization: Excel offers a wide range of formatting options that allow you to customize your reports to match your company’s branding and style.
- Accuracy: Excel has built-in formulas and functions that can perform calculations and analysis, saving you time and reducing the risk of human error.
- Compatibility: Excel files can be easily shared and edited by multiple users, allowing for collaboration and version control.
Tips for creating financial reports in Excel
1. Start with a template
Creating a financial report from scratch can be time-consuming and overwhelming. To make the process easier, start with a pre-designed template that you can customize to fit your needs. Excel offers a variety of templates for financial reports, such as balance sheets, income statements, and cash flow statements.
2. Use formulas and functions
Excel has built-in formulas and functions that can automatically perform calculations, such as adding up totals and calculating percentages. This can save you time and reduce the risk of human error. Some useful formulas for financial reporting include SUM, AVERAGE, MAX, and MIN. You can also use functions such as IF, COUNTIF, and VLOOKUP to perform more complex calculations and analysis.
3. Format your data
Formatting your data can make it easier to read and understand. Use headings, font styles, and colors to make important information stand out. You can also use conditional formatting to highlight specific data based on certain criteria. For example, you can set up conditional formatting to highlight cells that contain values above or below a certain threshold.
4. Test your calculations
Before finalizing your financial report, it’s important to test your calculations to ensure they are accurate. Double-check your formulas and functions, and make sure they are referencing the correct cells. You can also use the Trace Precedents and Trace Dependents tools to verify your formulas and check for any errors.
Example formats for financial reports in Excel
1. Balance sheet
Balance Sheet
A balance sheet is a financial statement that reports a company’s assets, liabilities, and equity at a specific point in time. The following is an example format for a balance sheet in Excel:
- Assets: List all of the company’s assets, such as cash, accounts receivable, inventory, and property.
- Liabilities: List all of the company’s liabilities, such as accounts payable, loans, and taxes owed.
- Equity: Calculate the company’s equity by subtracting its liabilities from its assets.
2. Income statement
Income Statement
An income statement is a financial statement that reports a company’s revenues and expenses over a specific period of time. The following is an example format for an income statement in Excel:
- Revenue: List all of the company’s sources of revenue, such as sales, services rendered, and interest income.
- Expenses: List all of the company’s expenses, such as salaries, rent, utilities, and marketing.
- Net Income: Calculate the company’s net income by subtracting its expenses from its revenue. This figure represents the company’s profit or loss for the period.
FAQ: Frequently Asked Questions
1. What are some common errors to look out for in financial reporting with Excel?
Common errors in financial reporting with Excel include:
- Formula errors: This occurs when formulas are not properly entered or the wrong cell is referenced. To avoid this, double-check all your formulas and use the Trace Precedents and Trace Dependents tools to verify your calculations.
- Integration errors: This can occur when combining data from various sources. To avoid this, make sure all data is properly organized and compatible with Excel.
- Data Entry Errors: This can occur from human error. To reduce, verify that all data inputted is correct before utilizing it.
2. How can I use PivotTables in Excel to create financial reports?
PivotTables are a powerful tool that can simplify the process of creating financial reports in Excel. You can use PivotTables to analyze large amounts of data and create custom reports based on your specific needs. To create a PivotTable, you can start by selecting the data you want to include in the report, then going to the Insert tab and selecting PivotTable. From there, you can drag and drop fields to create your custom report.
Video Tutorial: Creating Financial Reports in Excel
With these tips and examples, creating financial reports in Excel should be a much more manageable task. Remember to start with a template, use formulas and functions, format your data, and test your calculations before finalizing your report. By utilizing Excel, you can streamline your financial reporting process and gain valuable insights into your company’s performance.

