Ladies and gentlemen, if you’re looking to up your Excel game, you’ve come to the right place! Today, we’re going to be discussing some fantastic tips and tricks to take your Excel skills to the next level. Whether you’re using Excel for work, school, or just as a personal tool, these tips will help you to be more efficient, organized, and ultimately more successful.
Tip #1: Writing Text Vertically in an Excel Cell
Have you ever wanted to write text vertically in an Excel cell, but don’t know how? Well, fear not my friends, because it’s actually a lot easier than you might think. Simply follow these steps:
- Select the cell(s) you want to write vertically in.
- Go to the “Alignment” tab in the “Format Cells” dialog box.
- Under “Orientation”, click the “Vertical Text” option.
- Click “OK” to save your changes.
And just like that, you can now write text vertically in your Excel cells. This is particularly useful if you need to fit a lot of text in a small space, or if you just want to mix things up a bit!
Tip #2: Making Your Text Wrap in Excel
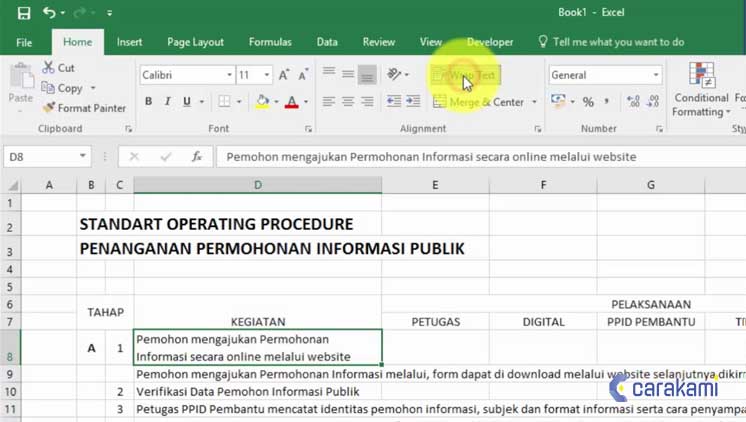
Do you find yourself running out of space on your Excel sheets because your text won’t wrap? This can be incredibly frustrating, but luckily it’s an easy fix. Here are the steps:
- Select the cell(s) you want to wrap text in.
- Click the “Wrap Text” button in the “Alignment” tab.
- Your text should now wrap to fit the cell, allowing you to see all of your content.
Now you can write as much as you want without worrying about running out of space. This is especially useful when working on lengthy projects or when presenting data to others.
FAQ
Q: How can I use Excel to create dynamic charts and graphs?
A: Excel has some amazing features when it comes to creating dynamic charts and graphs. One of the best ways to create dynamic charts is to use pivot tables. Pivot tables allow you to analyze data in a flexible way, creating charts and graphs that update automatically based on changes in your data. To create a pivot table, simply select the data you want to analyze, go to the “Insert” tab, and click “Pivot Table”. From there, you can customize your chart and graph to fit your needs.
Q: What are some good resources for learning more about Excel?
A: There are a lot of great resources out there for learning more about Excel. One of the best places to start is Microsoft’s official Excel help center. Here, you’ll find tutorials, videos, and other helpful resources to help you get started with Excel. Additionally, there are a number of online courses and tutorials, such as those offered by Udemy and Coursera, that can help you take your Excel skills to the next level.
Final Thoughts
Excel is an incredibly powerful tool, and by incorporating these tips and tricks into your workflow, you’ll be able to get even more out of it. Whether you’re using Excel for work, school, or just for personal use, these tips and tricks will help you to be more organized, efficient, and ultimately more successful. So give them a try, and see how they can help you!

