In the world of data analysis, it is important to have a good understanding of statistical analysis methods. One of the most commonly used methods is the Pearson correlation coefficient, also known as Pearson’s r. This method measures the strength and direction of the linear relationship between two variables. In this article, we will discuss what Pearson’s r is, how it is calculated, and how to interpret the results.
Cara Mencari T Hitung – Mama Baca
Before we discuss Pearson’s r, let’s first understand the concept of t-tests and how to calculate them. A t-test is a statistical hypothesis test in which the test statistic follows a Student’s t-distribution. It is used to determine whether there is a significant difference between the means of two groups. To calculate a t-test, we need to know the sample mean, sample size, and sample standard deviation for each group.
Here are the steps to calculate a t-test:
- Calculate the mean and standard deviation of each group
- Calculate the pooled standard deviation using the formula: spooled = sqrt( ( (n1-1) * s12 ) + ( (n2-1) * s22 ) / ( n1 + n2 – 2 ) )
- Calculate the t-value using the formula: t = ( x1 – x2 ) / ( spooled * sqrt( 1/n1 + 1/n2 ) )
If the absolute value of the t-value is greater than the critical value at the desired significance level (usually 0.05), then we reject the null hypothesis and conclude that there is a significant difference between the means of the two groups.
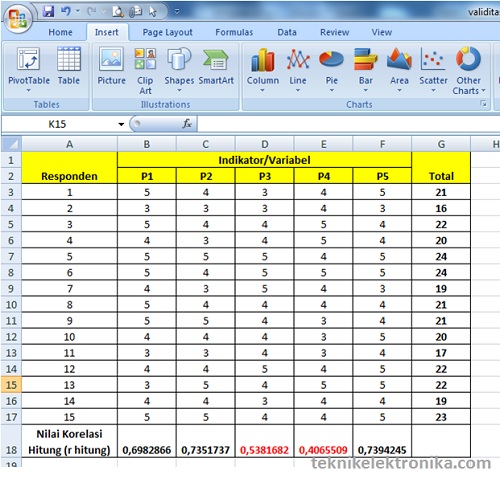
Cara Mencari R Hitung Dengan Excel
Let’s move on to Pearson’s r. Pearson’s r is a measure of the degree of linear relation between two variables. The value of r ranges between -1 and 1. A value of -1 indicates a perfect negative correlation, a value of 0 indicates no correlation, and a value of 1 indicates a perfect positive correlation.
We can use Microsoft Excel to calculate Pearson’s r. Here are the steps to do so:
- Enter the data for the two variables into two columns in Excel
- Select the two columns
- Click on the “Data” tab in the menu bar
- Click on the “Data Analysis” button in the “Analysis” section
- Select “Correlation” in the “Analysis Tools” section and click “OK”
- Select the two columns in the “Input Range” section
- Check the “Labels in first row” box if your data has column headers
- Select “Output Range” to specify where you want the output to appear
- Click “OK”
Excel will then generate a correlation matrix with the value of Pearson’s r for each pair of variables. The cell at the intersection of the two variables will contain the value of r.
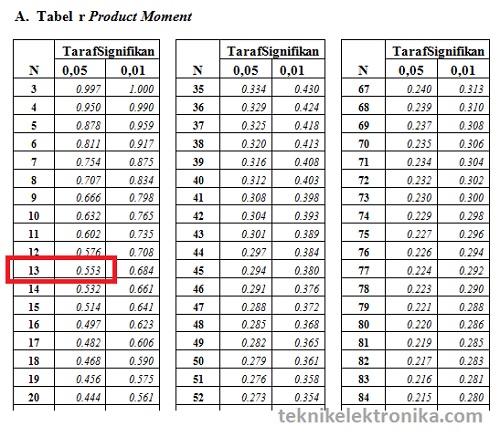
Cara Menghitung R Tabel Di Excel Microsoft Excel | My XXX Hot Girl
Once you have calculated Pearson’s r, it is important to interpret the results. The value of r alone is not sufficient to determine the significance of the correlation. We also need to calculate the p-value, which tells us the probability of obtaining the observed correlation by chance.
The p-value is calculated using the t-distribution and degrees of freedom. The degrees of freedom is equal to the sample size minus two. We can use Microsoft Excel to find the p-value using the “=ttest(array1,array2,tails,type)” function. The “array1” and “array2” arguments are the two sets of data, the “tails” argument is the number of tails in the distribution (1 or 2), and the “type” argument is the type of t-test (1 or 2).
Here are the steps to find the p-value in Excel:
- Enter the data for the two variables into two columns in Excel
- Select the two columns
- Click on the “Formulas” tab in the menu bar
- Click on the “More Functions” button
- Select “Statistical” in the “Select a category” section
- Select “=T.TEST” and click “OK”
- Enter the two variables in the “Array 1” and “Array 2” boxes
- Enter the number of tails in the “Tails” box (usually 2)
- Enter the type of t-test in the “Type” box (usually 2)
- Click “OK”
- The p-value will appear in the cell
Cara Menghitung Penjumlahan Di Excel – Toko Rifqi
Now that we understand how to calculate Pearson’s r and the p-value, let’s discuss how to interpret the results. A high value of Pearson’s r indicates a strong linear relationship between the two variables, while a low value indicates a weak or no relationship. The direction of the relationship can be positive or negative.
The closer the p-value is to zero, the more significant the correlation is. Typically, a p-value of less than 0.05 is considered significant, meaning there is less than a 5% chance of obtaining the observed correlation by chance.
It is important to note that correlation does not imply causation. Just because two variables are correlated does not mean that one causes the other. There may be other variables or factors that contribute to the relationship.
Cara Uji Validitas Kuesioner dengan Microsoft Excel
In conclusion, Pearson’s r is a useful tool for measuring the linear relationship between two variables. By calculating the correlation coefficient and p-value, we can determine the strength and significance of the relationship. It is important to remember that correlation does not imply causation and that there may be other variables at play.
FAQ
Apa itu Pearson’s r?
Pearson’s r adalah koefisien korelasi yang mengukur kekuatan dan arah hubungan linear antara dua variabel.
Bagaimana cara menghitung Pearson’s r?
Pearson’s r dapat dihitung dengan menghitung kovarians dan standar deviasi dari masing-masing variabel, kemudian membagi kovarians dengan hasil kali standar deviasi keduanya. Metode lain yang lebih mudah adalah dengan menggunakan perangkat lunak seperti Microsoft Excel.


