When it comes to managing inventory and data, Excel is the go-to software for many businesses. With its easy-to-use interface and familiar layout, Excel makes it simple to create databases, graphs, and other tools to manage inventory and data. So let’s explore some tips and tricks to improve our Excel skills.
Cara Membuat Sistem Stok Barang
Managing inventory can be a difficult task, but with Excel, it can be made much simpler. By creating a system to track inventory, you can ensure that you never run out of stock and always know what products are available. Here are the steps to create a system to manage your stock in Excel:
- Create a new Excel workbook and name it “Inventory.”
- Enter your product names, descriptions, and quantities in columns A, B, and C, respectively.
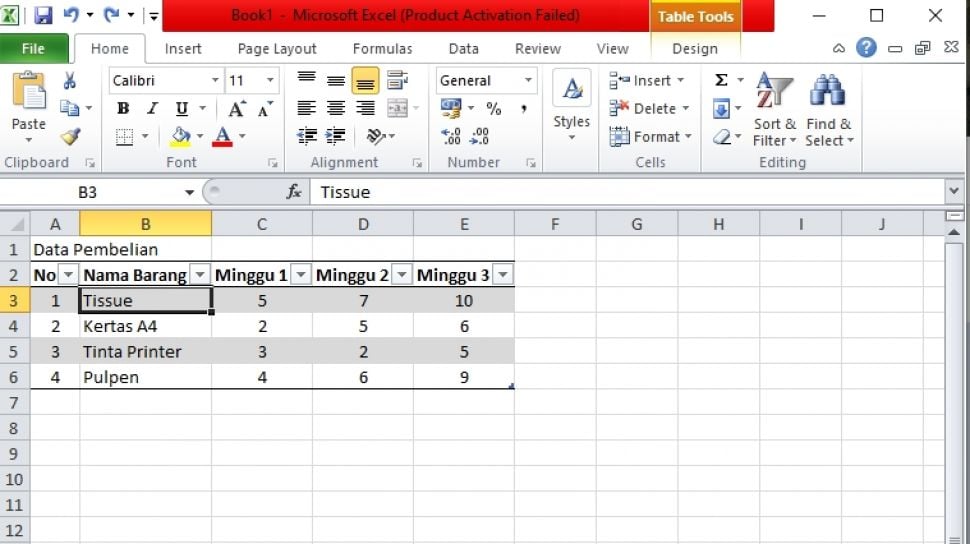
- Select the entire range of cells that contain your data (A1:C5), and click the “Format as Table” button in the “Home” tab of the ribbon.
- Select a table style that you like and click “OK.”
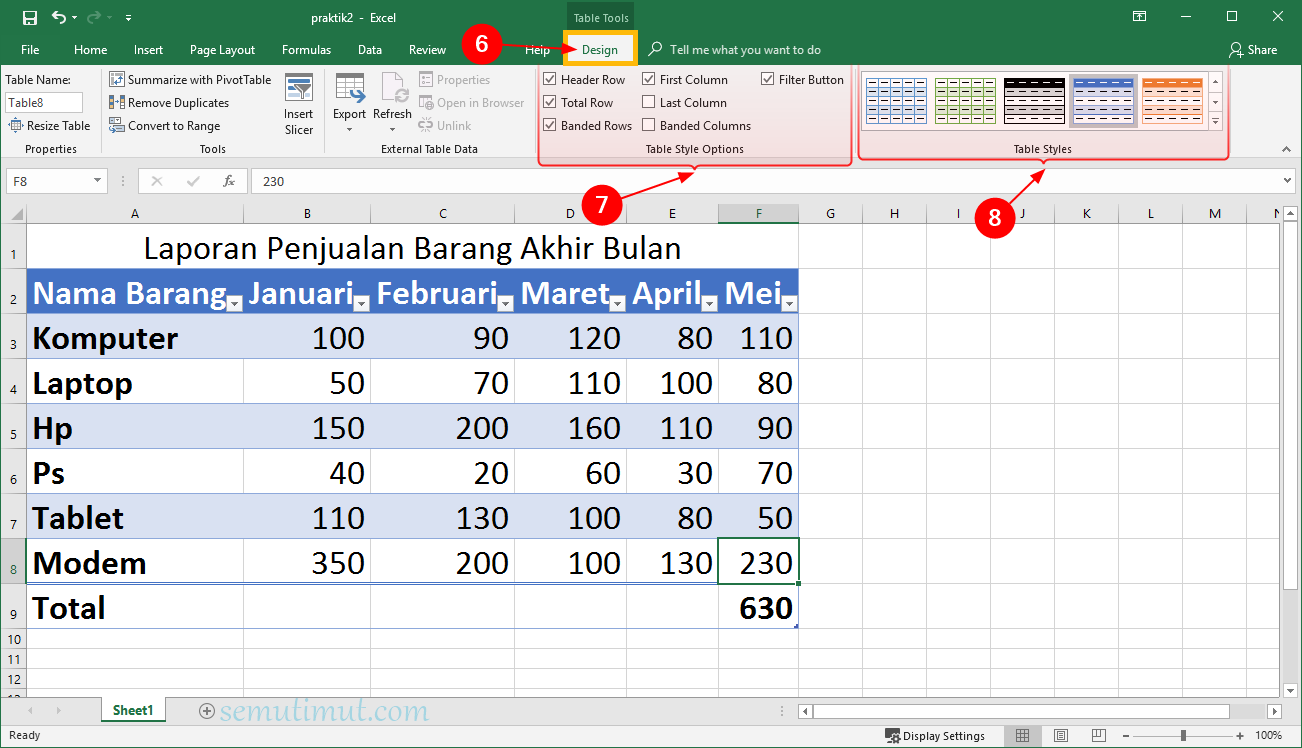
- Click on any cell within the table, and then click the “Table Tools” > “Design” tab in the ribbon.
- Within the “Table Styles Options” group, select “Total Row.”
- Type in a name for your total row, such as “Total,” and select the “Sum” function for the “Quantity” column.
- Save your workbook, and you now have a system in place to track your inventory.
Cara Mengetik Di Excel Dengan Mudah
Typing in Excel can be a bit tricky, especially if you’re not used to the software’s layout. But with some tips and tricks, you can speed up your typing and make it much easier to work in Excel. Here are some tips for typing in Excel:
- Use keyboard shortcuts: Excel has a ton of keyboard shortcuts that can save you time when typing. For example, pressing “Ctrl + Shift + L” will toggle the “Filter” command on and off.
- Use AutoCorrect: Typing long words or phrases can be a pain, but with AutoCorrect, you can set Excel to automatically insert a specific word or phrase when you type in a specific abbreviation. For example, you can set AutoCorrect to insert your entire company name when you type “mycompany.”
- Use Data Validation: Data Validation is a tool in Excel that allows you to limit the type of data that can be entered into a cell. This can be a huge time-saver, as it eliminates the need to constantly check for errors and fix mistakes. For example, you can set Data Validation to only allow numbers to be entered into a specific cell.
Cara Membuat Database Di Excel Dengan Mudah
Creating a database in Excel is a great way to organize and manage large amounts of data. By following these simple steps, you can create your own database in Excel:
- Create a new Excel workbook and name it “Database.”
- Create a new worksheet and name it “Data.”
- Enter your data in columns A to E, with each column representing a different field in your database.
- Select the entire range of cells that contain your data (A1:E5), and click the “Format as Table” button in the “Home” tab of the ribbon.
- Select a table style that you like and click “OK.”
- Save your workbook, and you now have a database in Excel.
Cara Membuat Grafik Di Excel
Creating graphs in Excel can be a great way to visualize data and make it easier to understand. Here are the steps to create a graph in Excel:
- Select the range of cells that you want to include in your graph.
- Click on the “Insert” tab, and then select the type of graph that you want to create from the “Charts” group.
- Customize your graph by selecting different chart styles, colors, and labels. You can do this by clicking on the chart and then selecting the appropriate options from the “Chart Tools” > “Design” tab in the ribbon.
- Save your workbook, and you now have a graph in Excel.
Cara Membuat Tabel di Excel Berwarna Otomatis
Color-coding your data in Excel can be a great way to make it easier to read and understand. Here are the steps to create a table with alternating colors in Excel:
- Create your table in Excel by entering your data into separate cells.
- Select the entire range of cells that contain your data (A1:C5), and click the “Format as Table” button in the “Home” tab of the ribbon.
- Hover your mouse over the table styles in the “Table Styles” group, and Excel will preview how each style would look on your table. Select a style that you like, or click “New Table Style” to create your own.
- From the “Table Tools” > “Design” tab, select “Table Style Options,” and then select “First Column” and “Banded Rows.”
- Save your workbook, and you now have a table with alternating colors in Excel.
FAQs
What is Excel?
Excel is a spreadsheet program developed by Microsoft that allows users to store, organize, and manipulate data using rows and columns.
Can I embed a Youtube video in Excel?
No, you cannot embed a Youtube video directly in Excel. However, you can include a hyperlink to a Youtube video or insert a screenshot or image of the video on your worksheet.


