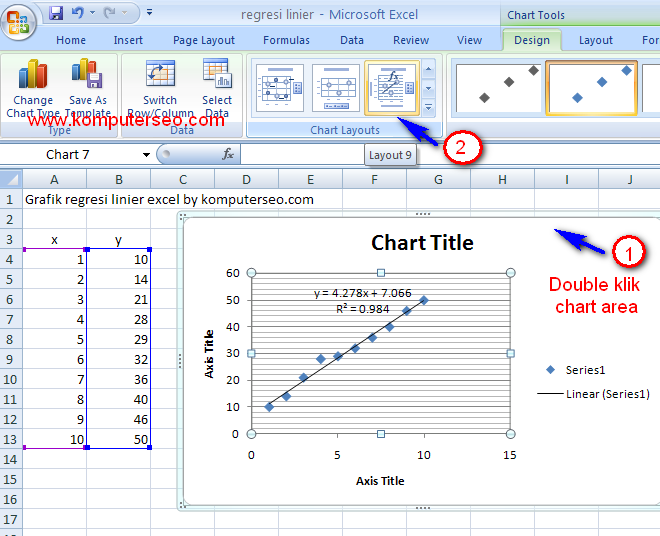
Linear regression analysis is a powerful tool that you can use to explore the relationship between two quantitative variables. Essentially, it helps you determine whether there’s a correlation between two variables, and if so, how strong that correlation is. Linear regression can be an insightful way to uncover trends and patterns in your data, and Excel makes it easy to perform regression analysis right from your computer.
Cara Mudah Menentukan Analisis Regresi Linier di Excel
If you’re new to Excel, or linear regression for that matter, it can be intimidating to get started. But don’t worry, Excel has you covered. Here’s how you can easily perform linear regression analysis using Excel:
Histogram
The first thing you’ll need to do is get your data in order. Make sure it’s in a format that Excel can understand, such as a table or a list. Once you’ve done that, select the data you want to use for your regression analysis, then click on the “Insert” tab. From there, you’ll see a “Recommended Charts” section. Click on the “All Charts” option, then select “Histogram.” This will create a chart that shows the distribution of your data.
Once you have your histogram, you can start thinking about how to perform regression analysis. There are essentially two ways to do this: using the built-in Excel features or using a third-party regression add-in. For now, we’ll focus on the built-in features.
Scatter Plot
To create a scatter plot, click on the “Chart” tab. From there, select “Scatter” and then choose the scatter plot that best fits your data. This will create a chart that plots your data points on a graph.
The scatter plot is essential for performing regression analysis, as it allows you to see how your data points are distributed. Essentially, what you’re looking for is a pattern in your data that suggests a correlation between the two variables you’re analyzing. If you see a pattern, you can start thinking about how to perform regression analysis to determine the strength of the correlation.
Linear Regression
To perform linear regression analysis in Excel, you’ll need to use the “Analysis Tools” feature. Click on the “Data” tab, then select “Data Analysis” from the menu. From there, choose “Regression” and click “OK.”
This will open a new window with all the options you need to perform regression analysis. First, choose the “Input Y Range” and “Input X Range” fields, which represent the two variables you want to analyze. Then, select the “Output Range” field to choose where you want Excel to output the results of the analysis. Finally, click “OK.”
Once you’ve performed the regression analysis, you’ll see a summary of the results in the output range you selected. There are several important pieces of information you can extract from these results, such as the regression equation, the coefficient of determination (R-squared), and the p-value. All of these can help you better understand the correlation between the two variables you’re analyzing and how strong that correlation is.
FAQ
1. Why is linear regression analysis important?
Linear regression analysis is important because it helps you understand how two variables are related. This can be valuable in a number of contexts, such as business, science, and social science. For example, if you’re studying the relationship between advertising spend and sales, linear regression can help you determine whether there’s a correlation between the two and how strong that correlation is. This can then inform your business decisions moving forward.
2. What are some common pitfalls to avoid when performing linear regression analysis?
One common pitfall to avoid when performing linear regression analysis is assuming that correlation equals causation. Just because two variables are correlated doesn’t necessarily mean that one caused the other. Another pitfall is failing to check the assumptions of linear regression, such as linearity, independence, homoscedasticity, and normality. Finally, make sure to consider the sample size of your data. If you’re working with a small sample size, for example, your results may not be statistically significant.


