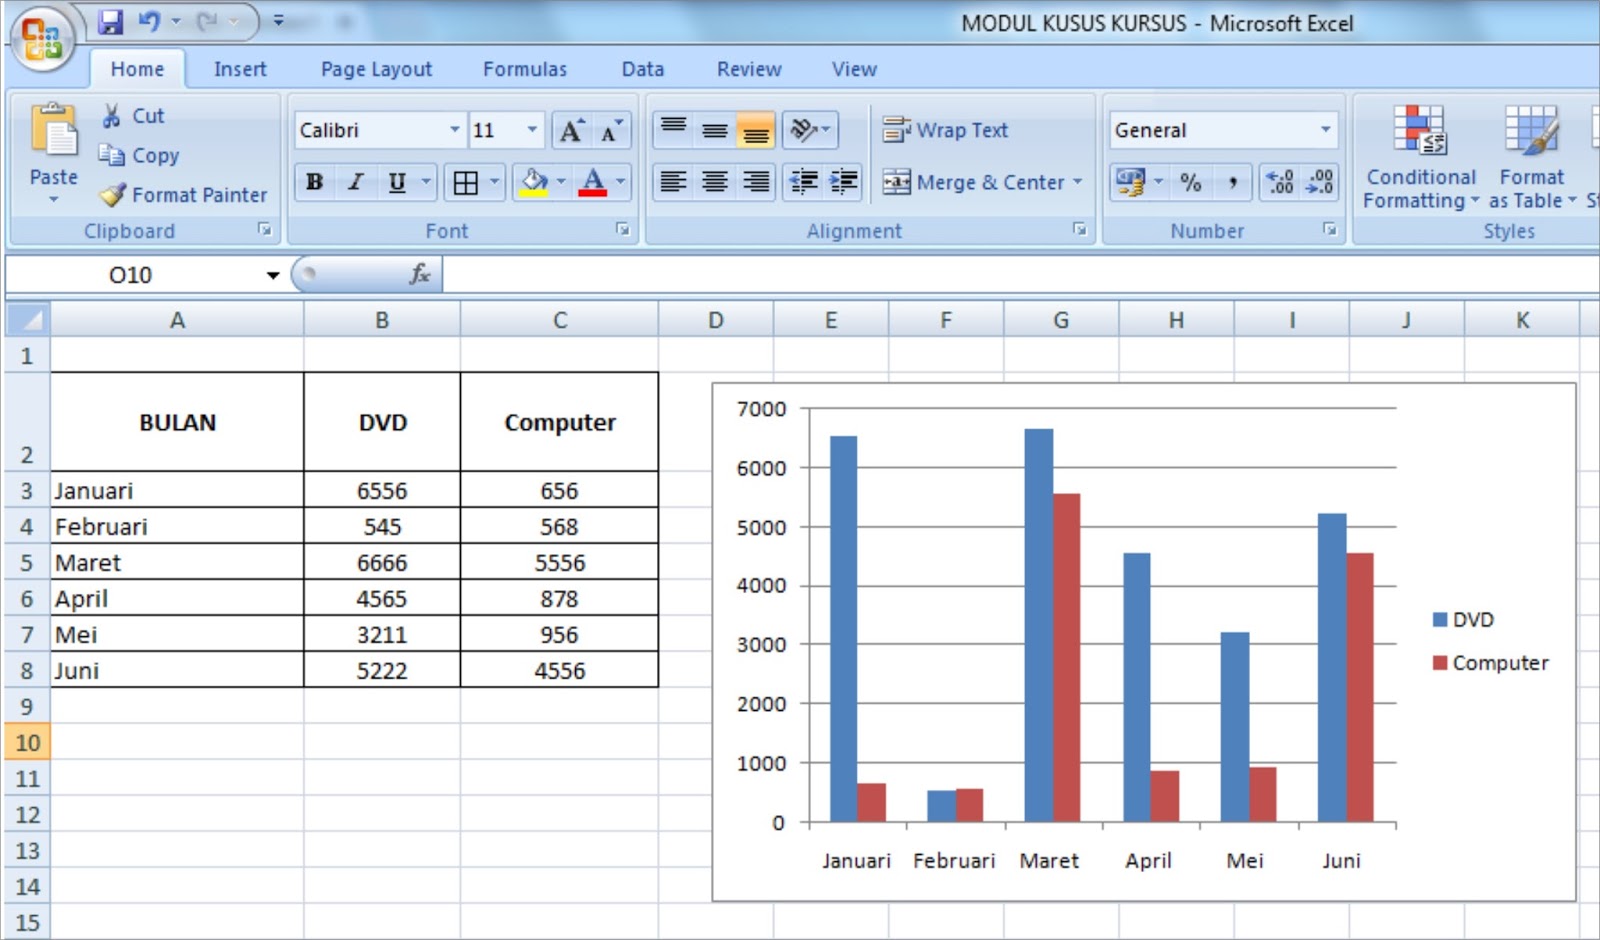
Microsoft Excel is one of the most widely used spreadsheet programs in the world. Whether you’re compiling data, creating graphs, or simply organizing information, Excel can help simplify the process. However, many users struggle when it comes to differentiating between the contents of different cells in an Excel table. That’s why we’ve put together this article to teach you how to color-code your cells and make your data analysis more efficient.
The Importance of Color-Coding Your Excel Table
When you’re working with a large amount of data in Excel, it can be easy to lose track of where important information is located. By color-coding your cells, you can quickly and easily identify different categories of data. For instance, you could assign the color red to negative numbers and the color green to positive numbers. This would allow you to quickly differentiate between positive and negative data points, making it easier to analyze your data.
How to Color-Code Cells in Excel
Now that you understand the importance of color-coding your Excel table, let’s take a look at how to actually do it. Follow these steps:
- Select the cells you want to color-code.
- Click on the “Home” tab at the top of your Excel window.
- Click on the “Conditional Formatting” button.
- Select “Color Scales” from the drop-down menu.
- Select the color scale you want to use. For instance, you could choose the “Red – Yellow – Green” scale.
- Click “OK.”
Congratulations! You’ve now assigned a color scale to your Excel table. You’ll notice that the cells with the lowest values are colored red, while the cells with the highest values are colored green. This makes it easy to differentiate between different categories of data.
Other Ways to Differentiate Between Cells in Excel
While color-coding is certainly a useful tool, it’s not the only way to differentiate between the contents of different cells in an Excel table. Let’s take a look at a few other methods you can use:
- Borders: You can add borders to your cells to create a visual distinction between different categories of data. To add a border, select the cells you want to add a border to, click on the “Home” tab, and then click on the “Borders” button. You can choose from a variety of different border styles and colors.
- Font: You can also use different fonts and font sizes to differentiate between the contents of different cells. For instance, you might use bold font for important values, or larger font for headers and titles.
- Icons: Finally, you can use icons to visually represent different categories of data. For instance, you might use a red X icon to indicate negative values or a green check mark to indicate positive values.
FAQ
Q: Can I color-code only certain cells in an Excel table?
A: Yes, you can color-code only certain cells in an Excel table. Simply select the cells you want to color-code and follow the same steps outlined above.
Q: Can I create my own color scale in Excel?
A: Yes, you can create your own color scale in Excel. To do so, click on the “Conditional Formatting” button and then select “Color Scales.” From there, click on “Custom Color” and choose the colors and values you want to use for your scale.
Video Tutorial
If you prefer to learn by watching, check out this video tutorial on how to color-code your Excel table:
With these tips, you should be able to easily differentiate between the contents of different cells in your Excel table. Whether you’re using color-coding, borders, font, or icons, there are a variety of different methods you can use to organize and analyze your data. Hopefully, this article has helped you become more efficient and effective in your data analysis!


