Excel is an important tool that is used by millions of users globally for data analysis, recording financial information, creating schedules, and organising data. It can also be used to create tables, which can be an important asset when organising data. In this article, we will be sharing some tips and tricks on how to create tables in Excel.
How to Automatically Add Colours to Tables in Excel?
Excel allows you to add colours to your tables automatically, which can make it easier to read and organise data. Here is how to add colours automatically:
Step 1
You can start by selecting the table that you want to add colours to. Once you have selected the table, go to the “Home” tab and click on “Format as Table”.
Step 2
A dialogue box will appear that will allow you to choose the style of the table that you want. Once you have chosen your preferred style, click on “OK”.
Step 3
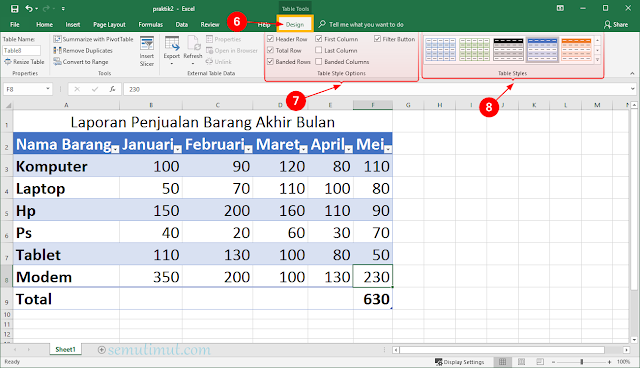
Once you have applied the table style, the “Design” tab will appear. Click on it and then click on “Table Styles”. From there, you can choose the colour that you want and apply it to your table.
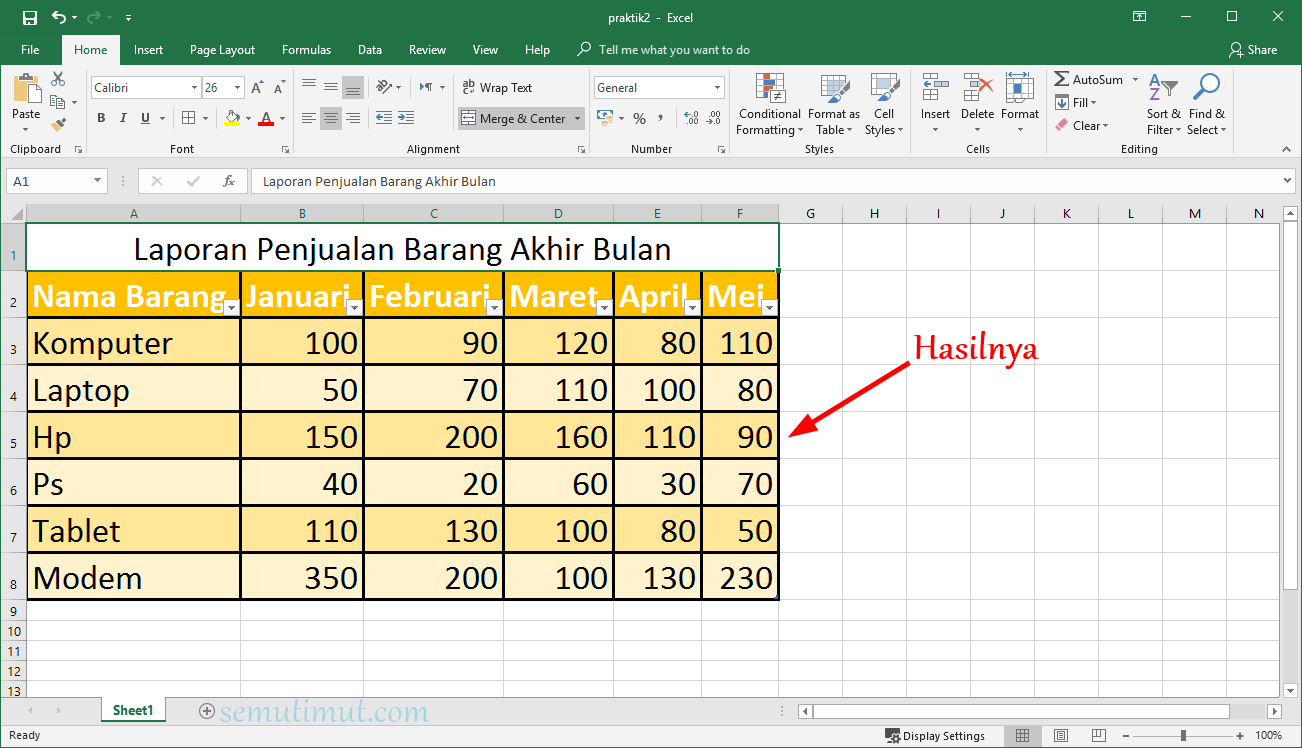
That’s it! Once you have followed the above steps, your table will be automatically colour-coded.
How to Create a Table Manually in Excel?
Manually creating a table in Excel is a simple process. Here is how to create a table manually:
Step 1
The first thing you need to do is open the Excel spreadsheet where you need to create the table. Once you have opened it, you should see a blank cell in the spreadsheet.
Step 2
Type in the headers for each column of your table. For example, if you are creating a table for sales data, you might want to have headers for “Product Name”, “Sales Price”, “Quantity Sold” and “Total Revenue”.
Step 3
Once you have typed in your headers, you can start adding in the data to your table. Simply click on the next cell and start typing in your data. If you need to add a new row to your table, simply right-click on any cell in the table and click on “Insert” and then “Insert Rows Above” or “Insert Rows Below”.
FAQs
What is Excel Used For?
Excel is a powerful tool that is used for many different purposes. It can be used for data analysis, financial calculations, creating schedules, and organising data. It is also commonly used in business settings to keep track of sales and financial data, as well as in academic settings for research and analysis.
What Are Some Shortcuts for Excel?
Excel has many shortcuts that can help save time and make it easier to use. Some popular shortcuts include:
- Ctrl + C to copy a cell or selection
- Ctrl + V to paste a cell or selection
- Ctrl + X to cut a cell or selection
- Ctrl + Z to undo an action
- Ctrl + Shift + L to add filters to your data
- Ctrl + S to save your work
Video Tutorial: How to Create a Table in Excel
Here’s a helpful video tutorial on how to create a table in Excel:
Excel is a powerful tool that can be used for a variety of purposes. Whether you need to organise data, create schedules, or perform financial calculations, Excel has features that can make your work easier and faster. By following our tips and tricks on how to create tables in Excel, you can improve your workflow and make your data more organised and visually appealing.

